Selection of Affected Individuals
Fingerlin et al (2004)
show that within family IBD sharing information can be used to improve the
power of genetic association studies. When the --select command line
option is used, MERLIN calculates the amount of sharing between each affected
individual in a family and other affected individuals.
Output files
Summary results for this analysis are stored in the file merlin.sel.
Each line in this file summarizes IBD sharing information for a particular
affected individual, location and trait. Results include the observed NPL pairs
score as well as the summed kinship coefficients between each affected individual
and all other affecteds.
This file can be analyzed manually, but for convenience the individual with
the highest score in each linked family is tagged with the words "LINKED BEST".
In unlinked families, only the word "BEST" appears. In the case of ties, one
of the individuals with equivalent sharing scores is selected at random.
These tags make it simple to extract a list including only the selected
cases, using the grep command. For example, the command:
prompt> grep "LINKED BEST" merlin.sel
Produces a list of individuals whoe share the most with other affecteds
in each family where the NPL statistic is greater than or equal to zero.
Alternatively, it is possible to extract a list of all individuals with the
most evidence for sharing with other affecteds in all families
(whether linked or not) with the following command:
prompt> grep "BEST" merlin.sel
Example

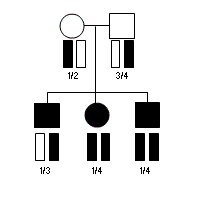
Consider the pedigree illustrated above, with three affected individuals genotyped
for a single microsatellite marker. In this pedigree, the chromosomes carried
by any affected individual are expected to occur a total of 4 times among all
affecteds and thus the expected sum of kinship coefficients is 1.0. At the genotyped
microsatellite marker, the chromosomes carried by the first affected individual occur
4 times among all affected individuals. In contrast, the chromosomes carried by the second
and third affected individuals occur 5 times (of a possible six) among the three affecteds
-- suggesting that these are more likely to carry risk alleles for the disease.
Analysing this family would produce the following output table:
| Family | Individual | Position | Trait |
NPL Score | Individual Score | |
| FAM_A | II-1 | Expected | Disease |
0.000 | 1.000 | |
| FAM_A | II-2 | Expected | Disease |
0.000 | 1.000 | |
| FAM_A | II-3 | Expected | Disease |
0.000 | 1.000 | |
| FAM_A | II-1 | Microsat | Disease |
0.816 | 1.000 | |
| FAM_A | II-2 | Microsat | Disease |
0.816 | 1.250 | LINKED BEST |
| FAM_A | II-3 | Microsat | Disease |
0.816 | 1.250 | |
Implementation Details
The selection strategy implemented in Merlin is analogous to Spairs(i) strategy described by Fingerlin et al (2004). It is calculated by pairing each affected
individual in turn with all other affected individuals and calculating the sum of their kinship coefficients. The
individual whose selection results in the highest sum is labeled the "BEST" in each family. While this strategy has
been shown to be nearly optimal in sibships, it is possible that other strategies (such as the
Sall(i) statistic suggested by Fingerlin et al)
perform better in extended pedigrees.
Key to the Output Table
The columns in the merlin.sel file correspond to:
| Column | Contents |
| Family |
The family id. Scores are grouped first by chromosome, then by family. |
| Individual |
The individual. There will be one row for each affected individual. |
| Position |
The position being analyzed. If this column reads expected, this row records
the expected sharing score Spairs(i) for each individual,
conditional on the pedigree structure, but ignoring the marker data |
| Trait |
The trait being evaluated. Each trait in the pedigree will be analyzed in turn. |
| NPL Score |
The family specific Spairs score, which can be used to
identify linked (Spairs > 0) and unlinked (Spairs < 0)
families. |
| Individual Score |
The individual Spairs(i) score, as defined by Fingerlin et al
(2004). This can be used to compare different affected individuals within a family. |
| Label |
Labels in this final column are helpful when using the UNIX command grep to identify the most
informative individuals. Each individual will either be untagged or marked "BEST" for the highest
individual score within each family (by trait and position). The additional tag "LINKED" will be
printed for individuals who have the highest score and are in a linked family (Spairs > 0). |
| 


