Association analysis tests for the association between a SNP and a trait of interest. In this section, we describe a couple of family-based association tests for quantitative traits. We also show the genotype inference feature integrated in the association tests to handle missing genotypes (Burdick et al. 2006). The rapid association test implemented in MERLIN can be used for genome-wide genome scan, and the genotype inference feature makes the association tests more powerful than conventional approaches. Although the association tests can be applied to family data, they do not control population stratification. If population stratification is a concern, population membership should be included as a covariate.
We first show an exemplary analysis. The dataset consists 20 pedigrees in three generations. At two loci, genotypes are missing for all individuals in the third generation. At other loci, genotypes are more complete. The dataset is organized into 3 files, a data file (assoc.dat)(Download), a pedigree file (assoc.ped)(Download), and a map file (assoc.map)(Download). An overview of MERLIN input files is available elsewhere.
To run MERLIN for the association analysis, we need to specify an input file (-d parameter), a pedigree file (-p parameter), and a map file (-m parameter). In addition, we need to request one of the following association tests: a score test (--fastAssoc) or a likelihood-ratio test (--assoc). The score test (--fastAssoc) is rapid and ideal for screening the whole genome in a genome-wide association (GWA) analysis, while the likelihood-ratio test (--assoc) can be used to test a candidate region to follow up the initial screening.
The command may look like:prompt> merlin -d assoc.dat -p assoc.ped -m assoc.map --fastAssocAfter running the command, you should see the following results:
Phenotype: trait [FAST-ASSOC] (20 families, h2 = 62.09%)
==============================================================================
  Position        Marker  Allele  Effect      H2     LOD  pvalue
    68.550          SNP1       3   0.024   0.02%   0.008     0.8
    69.582          SNP2       1   0.106   0.53%   0.204     0.3
    70.634          SNP3       3  -0.216   2.34%   0.884    0.04
    73.100          SNP4       1  -0.007   0.00%   0.001     0.9
    75.018          SNP5       3  -0.017   0.01%   0.005     0.9
    75.629          SNP6       3   0.423   5.93%   2.446  0.0008
    75.651          SNP7       1   0.423   5.93%   2.446  0.0008
    75.889          SNP8       1  -1.061  47.78%  18.724 1.6e-20
    75.889          SNP9       4   0.526  10.81%   3.747 0.00003
    76.700         SNP10       3   0.032   0.05%   0.020     0.8
    77.554         SNP11       1   0.067   0.19%   0.065     0.6
    77.627         SNP12       3   0.343   4.61%   1.787   0.004
    79.352         SNP13       1   0.042   0.07%   0.027     0.7
    79.443         SNP14       1   0.101   0.50%   0.190     0.3
    79.865         SNP15       1  -0.291   3.76%   1.510   0.008
    80.700         SNP16       1   0.206   2.08%   0.775    0.06
    81.238         SNP17       1  -0.184   1.28%   0.459    0.15
  Peak -->          SNP8       1  -1.061  47.78%  18.724 1.6e-20
The result above shows the fastAssoc analysis of phenotype "trait". The 7 columns are the position of a SNP, the name of the marker under test, the allele being test, the effect of the allele, the proportion of total variance explained by this allele, the LOD converted from the chi-square test statistic, and the p-value of the fastAssoc test. The last row indicates the peak locus at which the association is the strongest among all tests above.
Then the fastAssoc test is followed by the assoc test:prompt> merlin -d assoc.dat -p assoc.ped -m assoc.map --assoc --start 75.7 --stop 76.0After running the command, you should see the following results:
Phenotype: trait [ASSOC] (20 families, h2 = 62.09%)
==============================================================================
  Position     H2      LOD  pvalue        Marker Allele  Effect     LOD  pvalue
    75.889  77.14%    7.52 2.0e-09          SNP8      1  -1.141  24.982 7.7e-27
    75.889  77.14%    7.52 2.0e-09          SNP9      4   0.562   3.807 0.00003
This analysis (--assoc) only examines SNPs in region between 75.7cM (specified by parameter --start) and 76.0cM (specified by parameter --stop). The 9 columns in the result are the position of the SNP under test, the proportion of variance that is explained by the locus in a variance component linkage analysis, the LOD score of a VC linkage analysis (the corresponding parameter is --vc), the p-value of the VC linkage analysis, the name of the marker under test, the allele being tested, the effect of the allele, the LOD score converted from the likelihood-ratio test statistic, and the p-value of the assoc test. The last row indicates the peak locus at which the association is the strongest among all tests above.
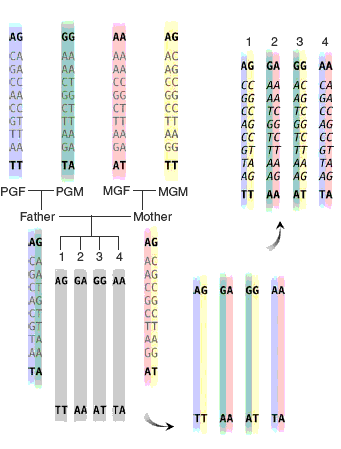
One unique feature of association tests in MERLIN is that missing genotypes are imputed and incorporated in an association test. A simple example of genotype inference is illustrated in the figure on the left (Burdick et al. 2006). All missing genotypes in the third generation are inferred in this example(the inferred genotypes are shown in italics). In this type of dataset, incomplete high resolution SNP data are combined with more complete sparse markers from a linkage scan. Burdick et al. (2006) show by incorporating the genotype inference procedure, the power of the association test can be substantially improved. This suggests in a genome-wide association study following a linkage study, only a porportion of individuals needs to be genotyped and genotypes of the remaining family members can be obtained by a genotype inference procedure. This genotyping strategy has been shown to be cost-effective.
The genotype inference procedure can be carried out separately from an association test. Posterior distributions are provided by MERLIN for all missing genotype. This function may be important for some cases, e.g., the association analysis of qualitative traits. The parameter for the genotype inference is --infer. The inferred data are stored in merlin-infer.dat and merlin-infer.ped. The command line for genotype inference may look like this:
prompt> merlin -d assoc.dat -p assoc.ped -m assoc.map --infer
In the inferred pedigree file (saved as merlin-infer.ped here), each locus is described in 5 columns: the most likely genotype for the missing genotype, the expectation of count for the tested allele, and the posterior probabilities for three genotypes. In the inferred data file (saved as merlin-infer.dat here), 5 rows corresponding to the 5 columns in the pedigree file are labeled as M, T, C, C, and C type respectively. The posterior probabilities can help infer a missing genotype: if one of the three posterior probabilities is large enough, then the missing genotype can be inferred as the genotype with the highest posterior probability; otherwise, if none of the posterior probabilities is large enough, then the missing genotype remains uninferred. In order to control the error rate of genotype inference, a high cutoff value, say, .99, is usually chosen for the posterior probabilities, so that the missing error rate is controlled to be less than 1%.
REFERENCE
Burdick JT, Chen WM, Abecasis GR, Cheung VG (2006) In silico method for inferring genotypes in pedigrees. Nat Genet 38:1002-4 [PDF]