
LocusZoom is a suite of tools to provide fast visualization of GWAS results for research and publication.
Original LocusZoom (R/Python) is ideal for batch generation of static plots.
LocusZoom.js (JavaScript) aims to make LocusZoom plots interactive and scriptable.
Interactive Plots with LocusZoom.js
Legacy Services (not actively maintained)
News
Planned Portaldev API downtime ~ November 13, 2020
We will be running operating system upgrades for the server that powers many of our data APIs (portaldev.sph.umich.edu). We have scheduled some downtime to install it next Friday Nov 13 @ 5:30PM (eastern US time). If you use interactive LocusZoom.js plots, you may notice either downtime or partial errors during this window, as many installations use our shared infrastructure for information like recombination rate, LD, and genes. Sample sites affected may include PheWeb, my.locuszoom.org, and certain parts of pages on the T2D Knowledge Portal.
This outage is expected to last < 3 hrs, and will not affect users of the standalone python locuszoom. We apologize for the inconvenience, and aim to make downtime as rare as possible.
--Andy Boughton
LocusZoom.js 0.12 released ~ August 14, 2020
We have released LocusZoom.js v0.12, with many new features and improvements. User-facing additions include interactive filtering of displayed elements (eg a dropdown menu to control which genes/pseudogenes are shown), a "save as PNG" feature, and updated default datasets for genes and GWAS catalog variants. For GRCh38 datasets, plots will now default to using a new and improved version of the 1000G LD reference panel that is based on deep whole-genome sequencing.
For developers, there are a number of additional features, but also some internal changes that may break existing sites. See the release notes for details.
All of the new features in LocusZoom.js 0.12.0 are also available in our plot-your-own-data tools for immediate use (LocalZoom and my.locuszoom.org). (try a demo)
Lastly, the upload service has been enhanced with a new feature: all newly uploaded datasets will now annotate provided SNPs with rsIDs from dbSNP where possible (based on chrom/pos/ref/alt information). If a match is found, the rsID will appear in the "top hits" table as well as association scatter plot tooltips.
--Andy Boughton
Explore more regions with new "batch view" mode ~ December 18, 2019
In our first two months, the new my.locuszoom.org upload service has been used by people in 48 countries. To thank our users, we have recently added several new features to the the site, including "nearest gene" annotations, user-selectable LD reference populations (from 1000G data), and a "batch view" to browse regions of interest more easily. We continue to improve our handling of diverse file formats, and welcome feedback or questions as always.
Following our commitment to reusable tools, the new LD chooser may be used with any site that uses LocusZoom.js (courtesy of the new v0.10 release). To further support custom LocusZoom usages, we have also refreshed the API documentation in response to feedback and questions.
--Andy Boughton
Planned Portaldev API downtime ~ November 6, 2019
A brief advance notice on planned downtime that might affect some LocusZoom users: We have recently received some new hardware for the server that powers many of our data APIs (portaldev.sph.umich.edu). We have scheduled some downtime to install it next Wednesday Nov 6 @ 2PM (eastern US time). If you use interactive LocusZoom.js plots, you may notice either downtime or partial errors during this window, as many installations use our shared infrastructure for information like recombination rate, LD, and genes. Sample sites affected may include PheWeb, my.locuszoom.org, and certain parts of pages on the T2D Knowledge Portal.
This outage is expected to last < 3 hrs, and will not affect users of the standalone python locuszoom. We apologize for the inconvenience: while we aim to make downtime very rare, this one will help us to better serve our users with new features going forward.
--Andy Boughton
Upload and share GWAS results with my.locuszoom.org ~ October 14, 2019
We are happy to announce the newest stage in our efforts to support interactive, exploratory GWAS plots: the new my.locuszoom.org upload-to-plot service. This new service generates fully interactive plots, with no limits on the number of loci you can explore. It also adds new features such as Manhattan and QQ plots, annotation options, and calculations that put findings in context. The default annotations support human datasets in builds GRCh37 or GRCh38; more annotation features are planned soon. Studies may be kept private, shared only with collaborators, or shared publicly.
We are still working on adding features to the new version. For the time being, this old site will remain active, but it is not actively maintained. We encourage you to try our new offerings ("LocalZoom" for sensitive data, and my.locuszoom.org for the full set of exploratory analysis features). We will be at ASHG to discuss these services, and any other LocusZoom.js questions you may have! (Poster 1660T, 3-4pm Thursday October 17)
--Andy Boughton
Explore your own data with LocalZoom ~ March 29, 2019
We have recently been working on ways to simplify generating an interactive plot with your own data, using only a web browser, without the need for a server. Our "LocalZoom" tool is the first visible step in this process- it is currently in beta, but can be helpful for exploratory analysis.
Features:- Generate a LocusZoom plot from a local file of summary statistics, in your web browser. No web server required. (you must tabix and bgzip the data yourself separately, and select *both* files when loading)
- Full support for build 37 or build 38 data (including genes, recombination rate, and LD)
- Compare up to 3 studies in a single plot
- Optionally annotate the plot with calculated 95% credible set (based on the data shown on the screen) and SNPs found in the EBI GWAS catalog. The credible set calculation results can be exported as table / CSV.
- Jump to region box: enter a region (10:114550452-115067678), or search by rsid/ gene name (exact match). The plot defaults to a region near the first few rows of your data.
- This tool only fetches the data needed for a single Locus at a time. It does not do anything that requires summarizing the entire dataset (eg manhattan plot).
- Your input file must contain all the data required to make the plot: chrom/pos/ref/alt/(log)pvalue. The tool does not work with rsids.
- You must manually select the build for your data. It does not auto-detect the build.
-
Some features are very much in beta- feedback and bug reports are highly welcome!
- It will try to auto-detect file columns, though you will often have better results selecting columns manually.
- The "load from URL" button requires that the server support both CORS and byte-range requests. Not all servers do this.
- Because the data stays on your computer, this tool does not provide a way to share a link with colleagues.
--Andy Boughton
Support for Interactive Annotation/BED Tracks ~ November 11, 2016
With its latest release (v0.4.8), LocusZoom.js now has built-in support for display of annotation/BED tracks. You can also see and work with annotation track data now on the Interactive Plot page.
--Christopher Clark
LocusZoom.js Poster at ASHG 2016 ~ October 13, 2016
Some members of the LocusZoom team will be at the American Society of Human Genetics conference in Vancouver, Canada from October 18-22. This will include the presentation of a poster describing the new interactive LocusZoom.js:
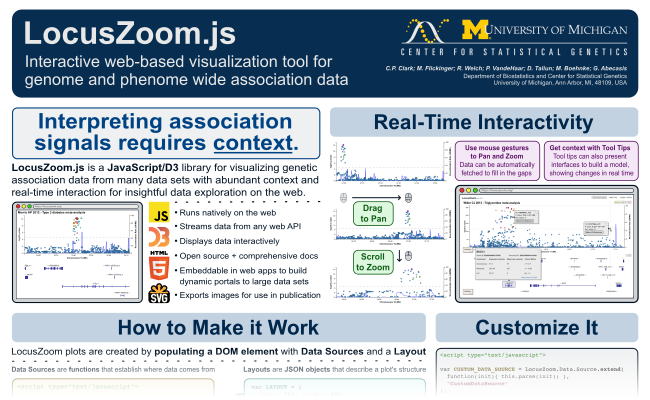
The poster will be located at 1829T in the Bioinformatics and Computational Approaches section. See and download the full resolution PDF of the poster here.
If you find yourself at ASHG this October please stop by! The poster session will be from 2PM-3PM on Thursday, October 20.
--Christopher Clark
Announcing LocusZoom.js ~ September 16, 2016
Recently the UM/CSG team began work on LocusZoom.js, a way of making LocusZoom embeddable and interactive.
Starting from scratch we developed a LocusZoom semi-clone entirely in Javascript with forward thinking into how it could be more extensible. Below is a flat image showing what a plot generated in LocusZoom.js can look like today:
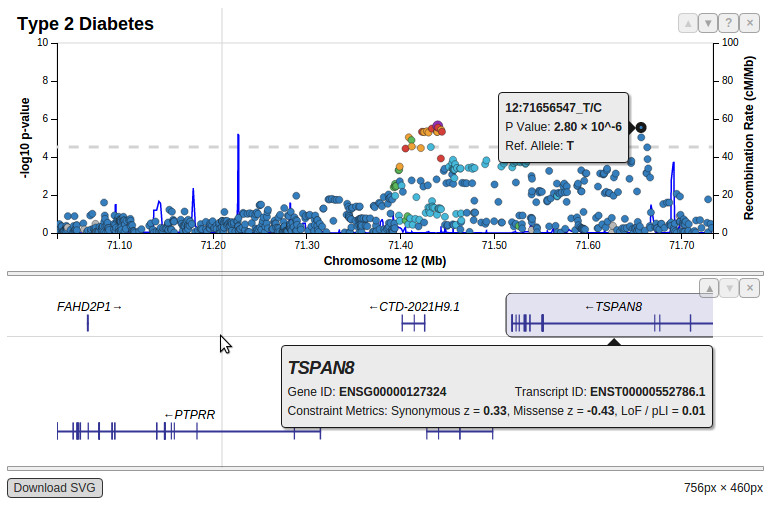
Being built for the web, interaction with the new LocusZoom.js is fundamentally different from how you would interact with Original LocusZoom (built in Python and R for command-line operation). To see for yourself begin by interactively plotting published GWAS results. Add arbitrarily many studies and navigate around the genome with your mouse. LocusZoom.js has not yet been hooked up to a form to upload your data here on this website, but it is open source and heavily documented so you can build your own applications with it. See the documentation and get the source code to get started!
The original LocusZoom (Python/R) for generating single/batch plots of your data or single plots of published GWAS datais still available here and will continue to be.
Please tell us what you think! Post your questions and feedback on the LocusZoom Message Board.
--Christopher Clark
First Publication ~ September, 2010
We are pleased to announce that our paper on LocusZoom has been published!
Reference: Pruim RJ*, Welch RP*, Sanna S, Teslovich TM, Chines PS, Gliedt TP, Boehnke M, Abecasis GR, Willer CJ. (2010) LocusZoom: Regional visualization of genome-wide association scan results. Bioinformatics 2010 September 15; 26(18): 2336.2337.
--Terry Gliedt
Links
User Survey
Interactive LocusZoom.js
Original LocusZoom
Publications
LocusZoom.js: interactive and embeddable visualization of genetic association study results
A.P. Boughton, R.P. Welch, et al., Bioinformatics (2021)LocusZoom: regional visualization of genome-wide association scan results
R.J. Pruim, R.P. Welch, et al., Bioinformatics (2010)LocusZoom.js: Web-based plugin for interactive analysis of genome and phenome wide association studies
C.P. Clark; M. Flickinger, et al., Presented at the 66th Annual Meeting of The American Society of Human Genetics, October 20, 2016, Vancouver, CanadaInteractive, shareable plots of GWAS data with LocusZoom
A.P. Boughton, R.P. Welch, et al., Presented at the 69th Annual Meeting of The American Society of Human Genetics, October 20, 2016, Houston, TXUsage Stats
Plots Generated by Original LocusZoom
| This week | 381 |
| Year 2024 | 10246 |
| Jan | 3169 |
| Feb | 2457 |
| Mar | 3306 |
| Apr | 1314 |
| Year 2023 | 36190 |
| Year 2022 | 37312 |
| Year 2021 | 46991 |
| Year 2020 | 60748 |
| Year 2019 | 83077 |
| Year 2018 | 94942 |
| Year 2017 | 88479 |
| Year 2016 | 88813 |
| Year 2015 | 96212 |
| Year 2014 | 97391 |
| Year 2013 | 87012 |
| Year 2012 | 69783 |
| Year 2011 | 50775 |
| Year 2010 | 22184 |