Part 2: Power for a candidate gene study
You may be curious as to the potential benefit of using a two-stage design to reduce
costs when examining far fewer markers than those interrogated during a genome-wide
association study, for example, when conducting a candidate gene study.
We will address this question by considering the following scenario. Suppose that you
have a collection of 1000 cases and 1000 controls, and would like to test 2000 SNPs located in
and around candidate genes. Assume again that the SNPs being tested are independent and that
you are willing to tolerate 2 false positives, allowing the use of a false postive rate of
2/2000 = .001. We can begin a power analysis as we did before, by determining what size
effects you will be able detect with high power using a one-stage design. Again, we will
consider the case when the disease of interests has prevalence of 10% and the risk allele
that has frequency of .30 in the population. Consider the results below.
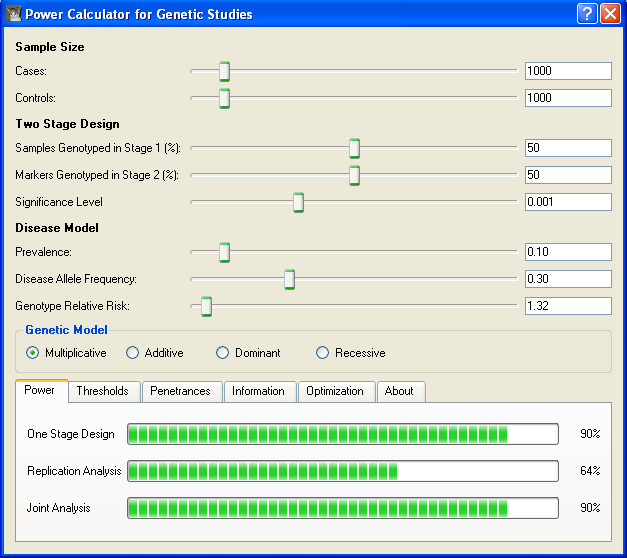
The above screen shot shows that a disease variant with GRR of 1.32 can be detected with
90% power using a one-stage design. And, as with the genome-wide association study, we see
that the same power can be achieved when genotyping 50% of the sample in stage 1 and
following up 50% of the markers into the second stage. We can again explore how genotyping
can be reduced while still retaining much of the one-stage power. By playing with sliders
controlling the percentage of samples genotyped in Stage 1 and the percentage of markers
genotyped in stage 2, we find that we can reduce the amount of genotyping by 49% while still
achieving power of about 88% by genotyping 35% of the sample in stage 1 and selecting 24% of the
markers for follow-up in stage 2.
You can continue the tutorial by learning about optimal designs or
you can return to the main tutorial menu and pick a different topic.
| 