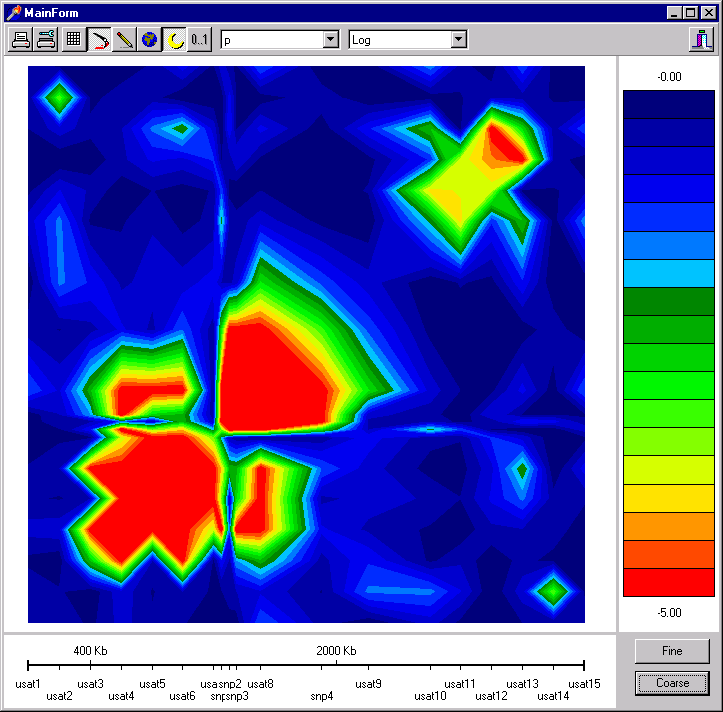
GOLD - Sample Screen
To load linkage disequilibrium statistics
double click on the main plot area. This area summarises disequilibrium
in the region, and can be customised as described below. A typical
display follows (this data is in the file sample.xt and sample.gm).

| 


