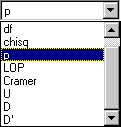
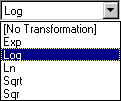
This allows selection of the statistic to be graphed and an
optional transformation. Various buttons allow users to customize
the appearance of their plots.Admittedly, the icons are obscure....
|

|
Printing - These two buttons give access to standard windows
Print and Print Setup dialogs. |
|

|
Raw Data Grid - Turns off interpolation, and displays
color coded raw data matrix. |
|

|
Fill - Specifies whether surfaces should be filled (default). |
|

|
Contour - Draws optional contours around each color. |
|

|
Spin - Uses the left handed version of the interpolation
algorithm. |
|

|
Negative Image - Inverts the color coding scheme (ie,
switches red and blue between top and bottom) |
|

|
Unit Scale - Assumes the measure of disequilibrium to
range between 0 (zero) and 1 (one). |
|

|
Statistic - selects the statistic to be graphed |
|

|
Transformation - Selects a transformation to be applied
to the statistic before graphing. |
|

|
Exit - Exits the program |


