Part 1: Power for a genome-wide association study
The power and thresholds for one- or two-stage genome-wide associations studies can be
easily found using CaTS. Consider a genome-wide association study in which 1500 case and 1500
controls are available and will be genotyped on 300,000 independent SNPs. And suppose that
you are willing to tolerate 3 false positives at the end of the study (suggesting that a
marker-wise false positive rate of 3/300,000 or .00001 should be used).
One common challenge in this setting is determining the smallest effect that
can be detected with 80% power using the available sample and desired false positive rate.
You need to supply some information to CaTS before this question can be answered. First, you
must tell CaTS the prevalence of your disease, and you need to choose a frequency for
the risk allele in the population. The frequency of the risk allele will have a substantial
impact on power, and so it is worth exploring how power changes for different allele
frequencies.
Let's consider an example where disease prevalence is 10% and the disease variant has
frequency of .30 in the population. The following screen shot of CaTS has these values
entered.
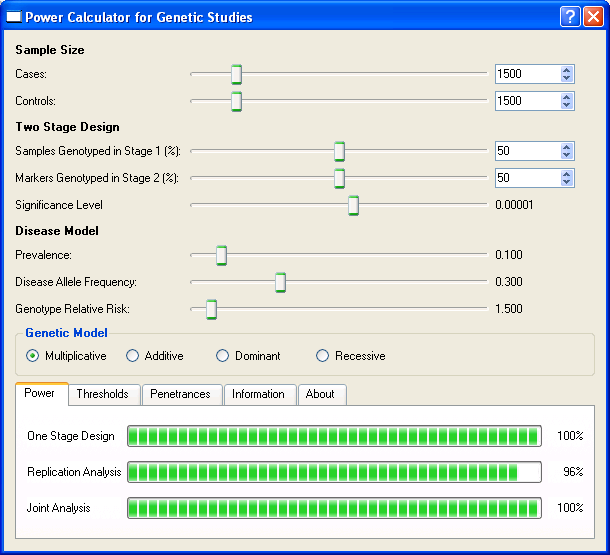
The results displayed in the CaTS power tab show that the one-stage design has 100% power
to detect a disease predisposing variant with genotype relative risk (GRR) of 1.5. The GRR
which give 80% power can be found easily by moving the Genotype Relative Risk slider until
the power beside the One Stage Design bar reads 80%. Go ahead and find it. You should
discover that 80% power is attained for a GRR value between 1.29 and 1.30.
CaTS can also be used to identify two-stage designs which attain almost all of the power
of the one-stage design. CaTS initially sets both the percentage of samples genotyped in
Stage 1 and the percentage of markers genotyped in Stage 2 to 50%. The power tab shows that
this two-stage design has the same power as the one-stage design. Explore how genotyping can
be reduced while retaining almost all of the power of the one stage design by moving the
sliders so that fewer samples are genotyped in stage 1 and fewer markers are followed up in
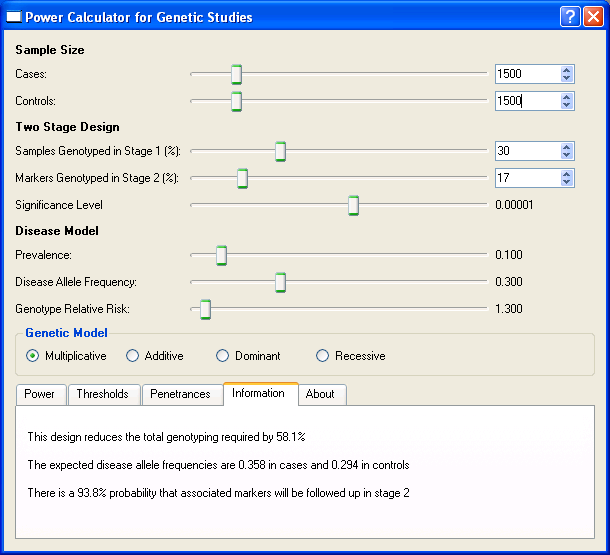
stage 2. For example, power of 80% can be achieved by genotyping only 19% of the sample in
stage 1 while following up 50% of the markers in stage 2. Similarly, 80% power can be
achieved by genotyping 30% of the samples in stage 1 and following up only 17% of the markers
in stage 2. Selecting the Information tab, as shown in the screenshot below, we can see that this design reduces the genotyping requirement by 58.1%. This tab also provides the
interesting tidbit that a disease predisposing marker with the specified effect size has a
probability of 93.8% of being selected for genotyping in stage 2.
You can continue the tutorial by looking at an examplar candidate gene study or
you can return to the main tutorial menu and pick a different topic.
| 