PSEUDO -- Graphical Output
PSEUDO can also create several useful graphical summaries of your
simulation results if you tell it to do so. To see graphical summaries simply append
the
--pdf option to your command line
pseudo -l pseudo.list -h pseudo.hyp --pdf -n 10000
After the code runs, you can view the results using a pdf viewer such as Adobe Acrobat
Reader. If you don't have a pdf
viewer, you can obtain a copy from the Adobe Acrobat
Reader website.
Distribution of hits
PSEUDO will send graphical output to a file called pseudo.pdf (or
.pdf if you use the --prefix str option)
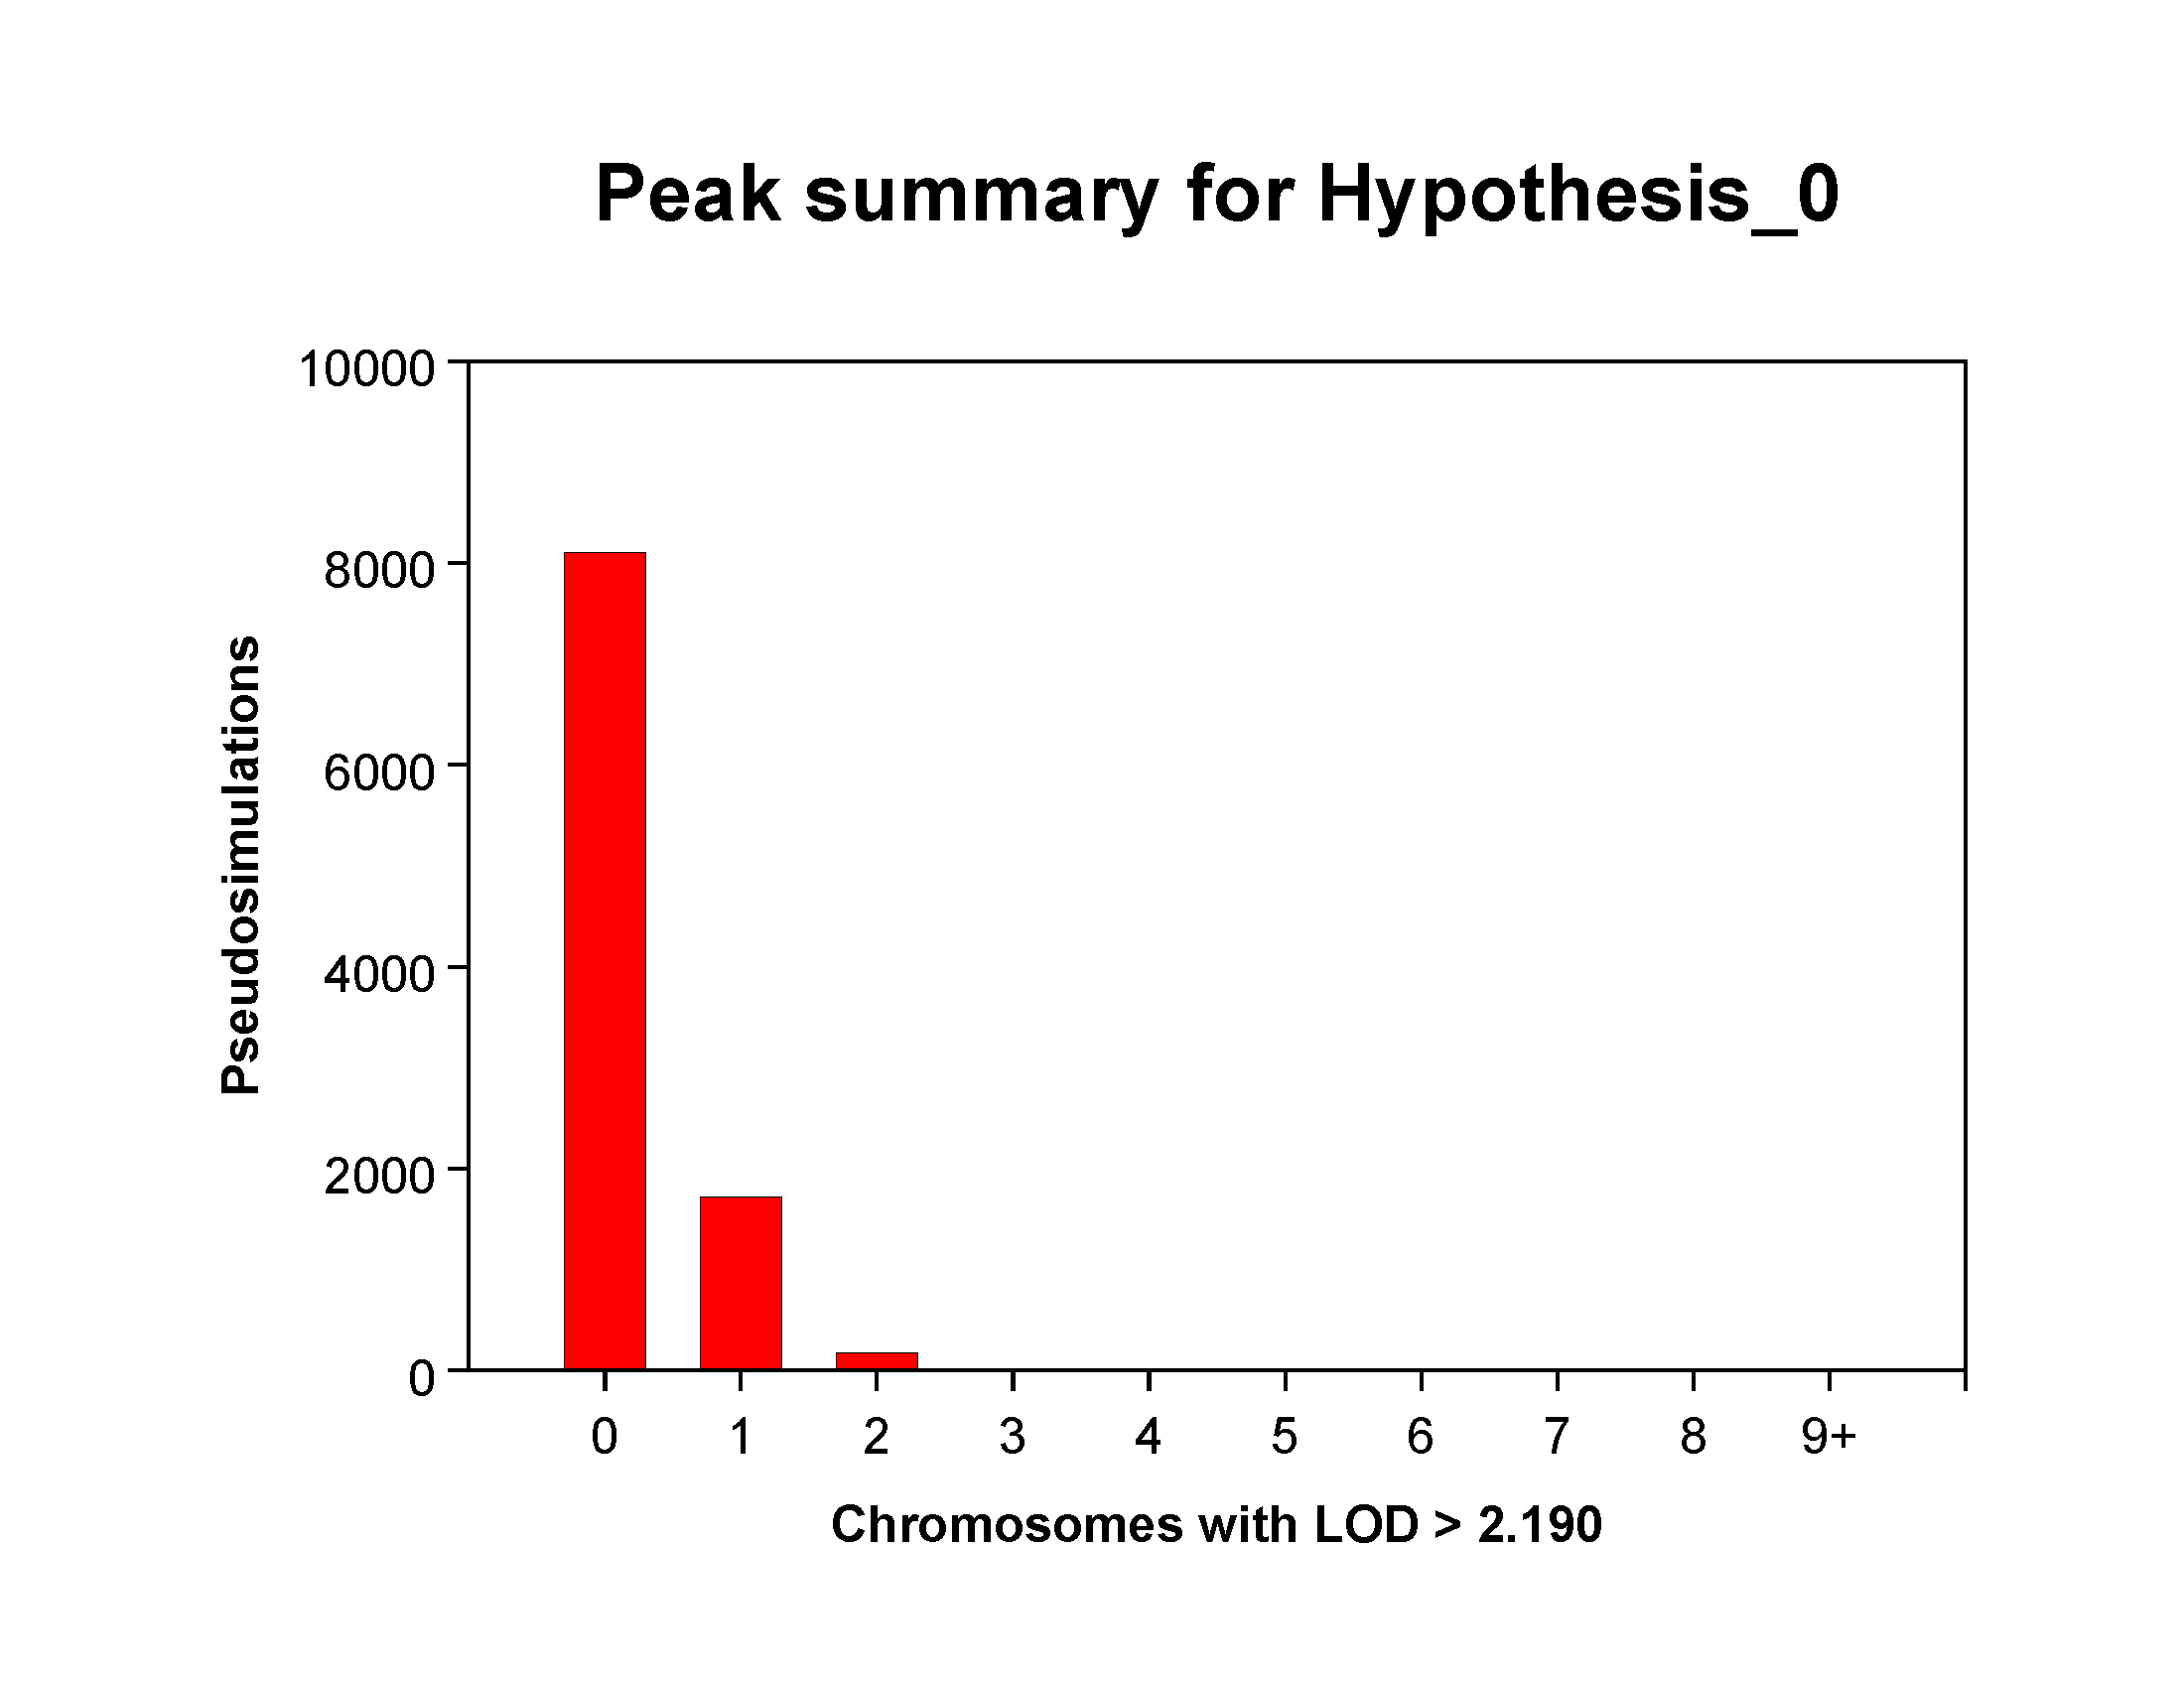
When you open it, the first page should be a graph similar to the one below, which
shows the distribution of "hits" (chromosomes with a maximum lod greater than 2.19)
among all simulated genome scans. For the current hypothesis (Hypothesis_0), most
(> 8000) simulations had no hits, while a bit less than 2000 had exactly one
chromosome hit. A few simulations (~100) had exactly 2 chromosomes with a "hit" and
a small number simulations had exactly 3 chromosome hits. If you're interested in
precise numbers for each category, you'll find them in he table titled "SIMULATED
DISTRIBUTION OF SIGNIFICANT CHROMOSOMES PER SIMULATION" in the text output produced by
the simulation.
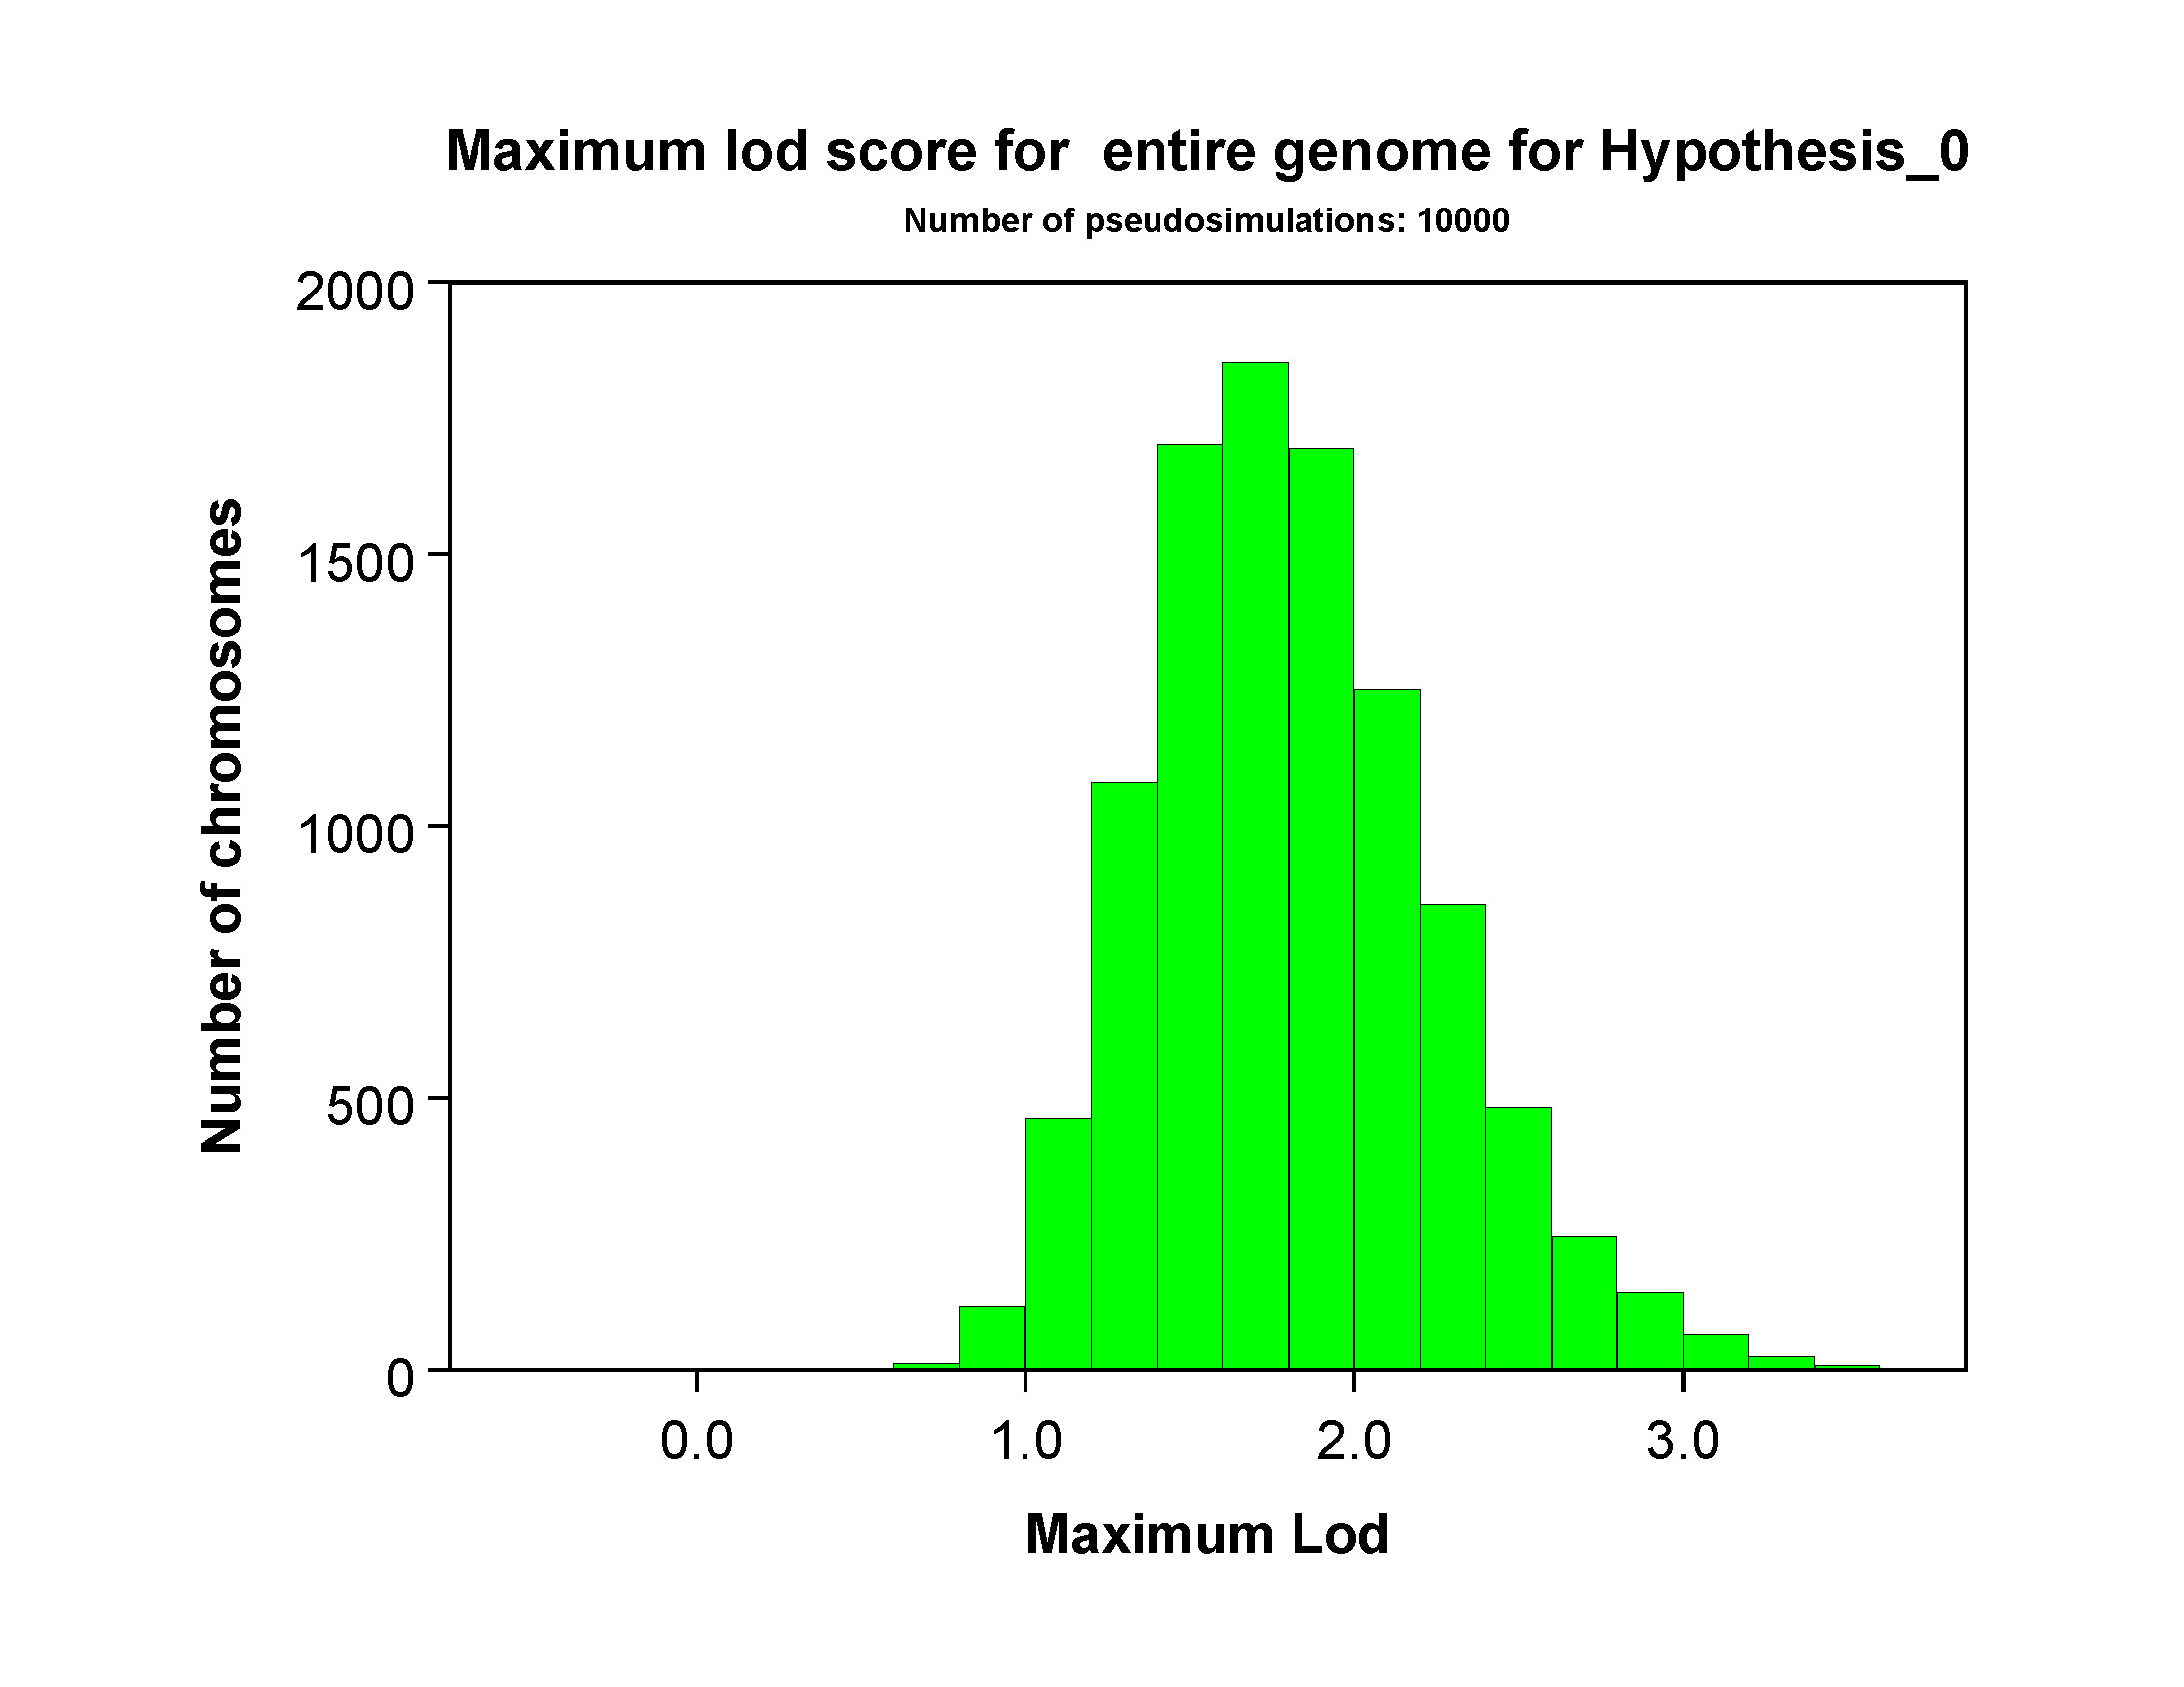
Maximum lod score distributions
The next section will include several pages with distributions of the maximum
genomewide lod score for each hypothesis. The figure below shows results for
Hypothesis 0 for a simulation with 10000 replicates. As might be expected, the
maximum lod score was distributed roughly normally, with a mean between 1.5 and 2.0.
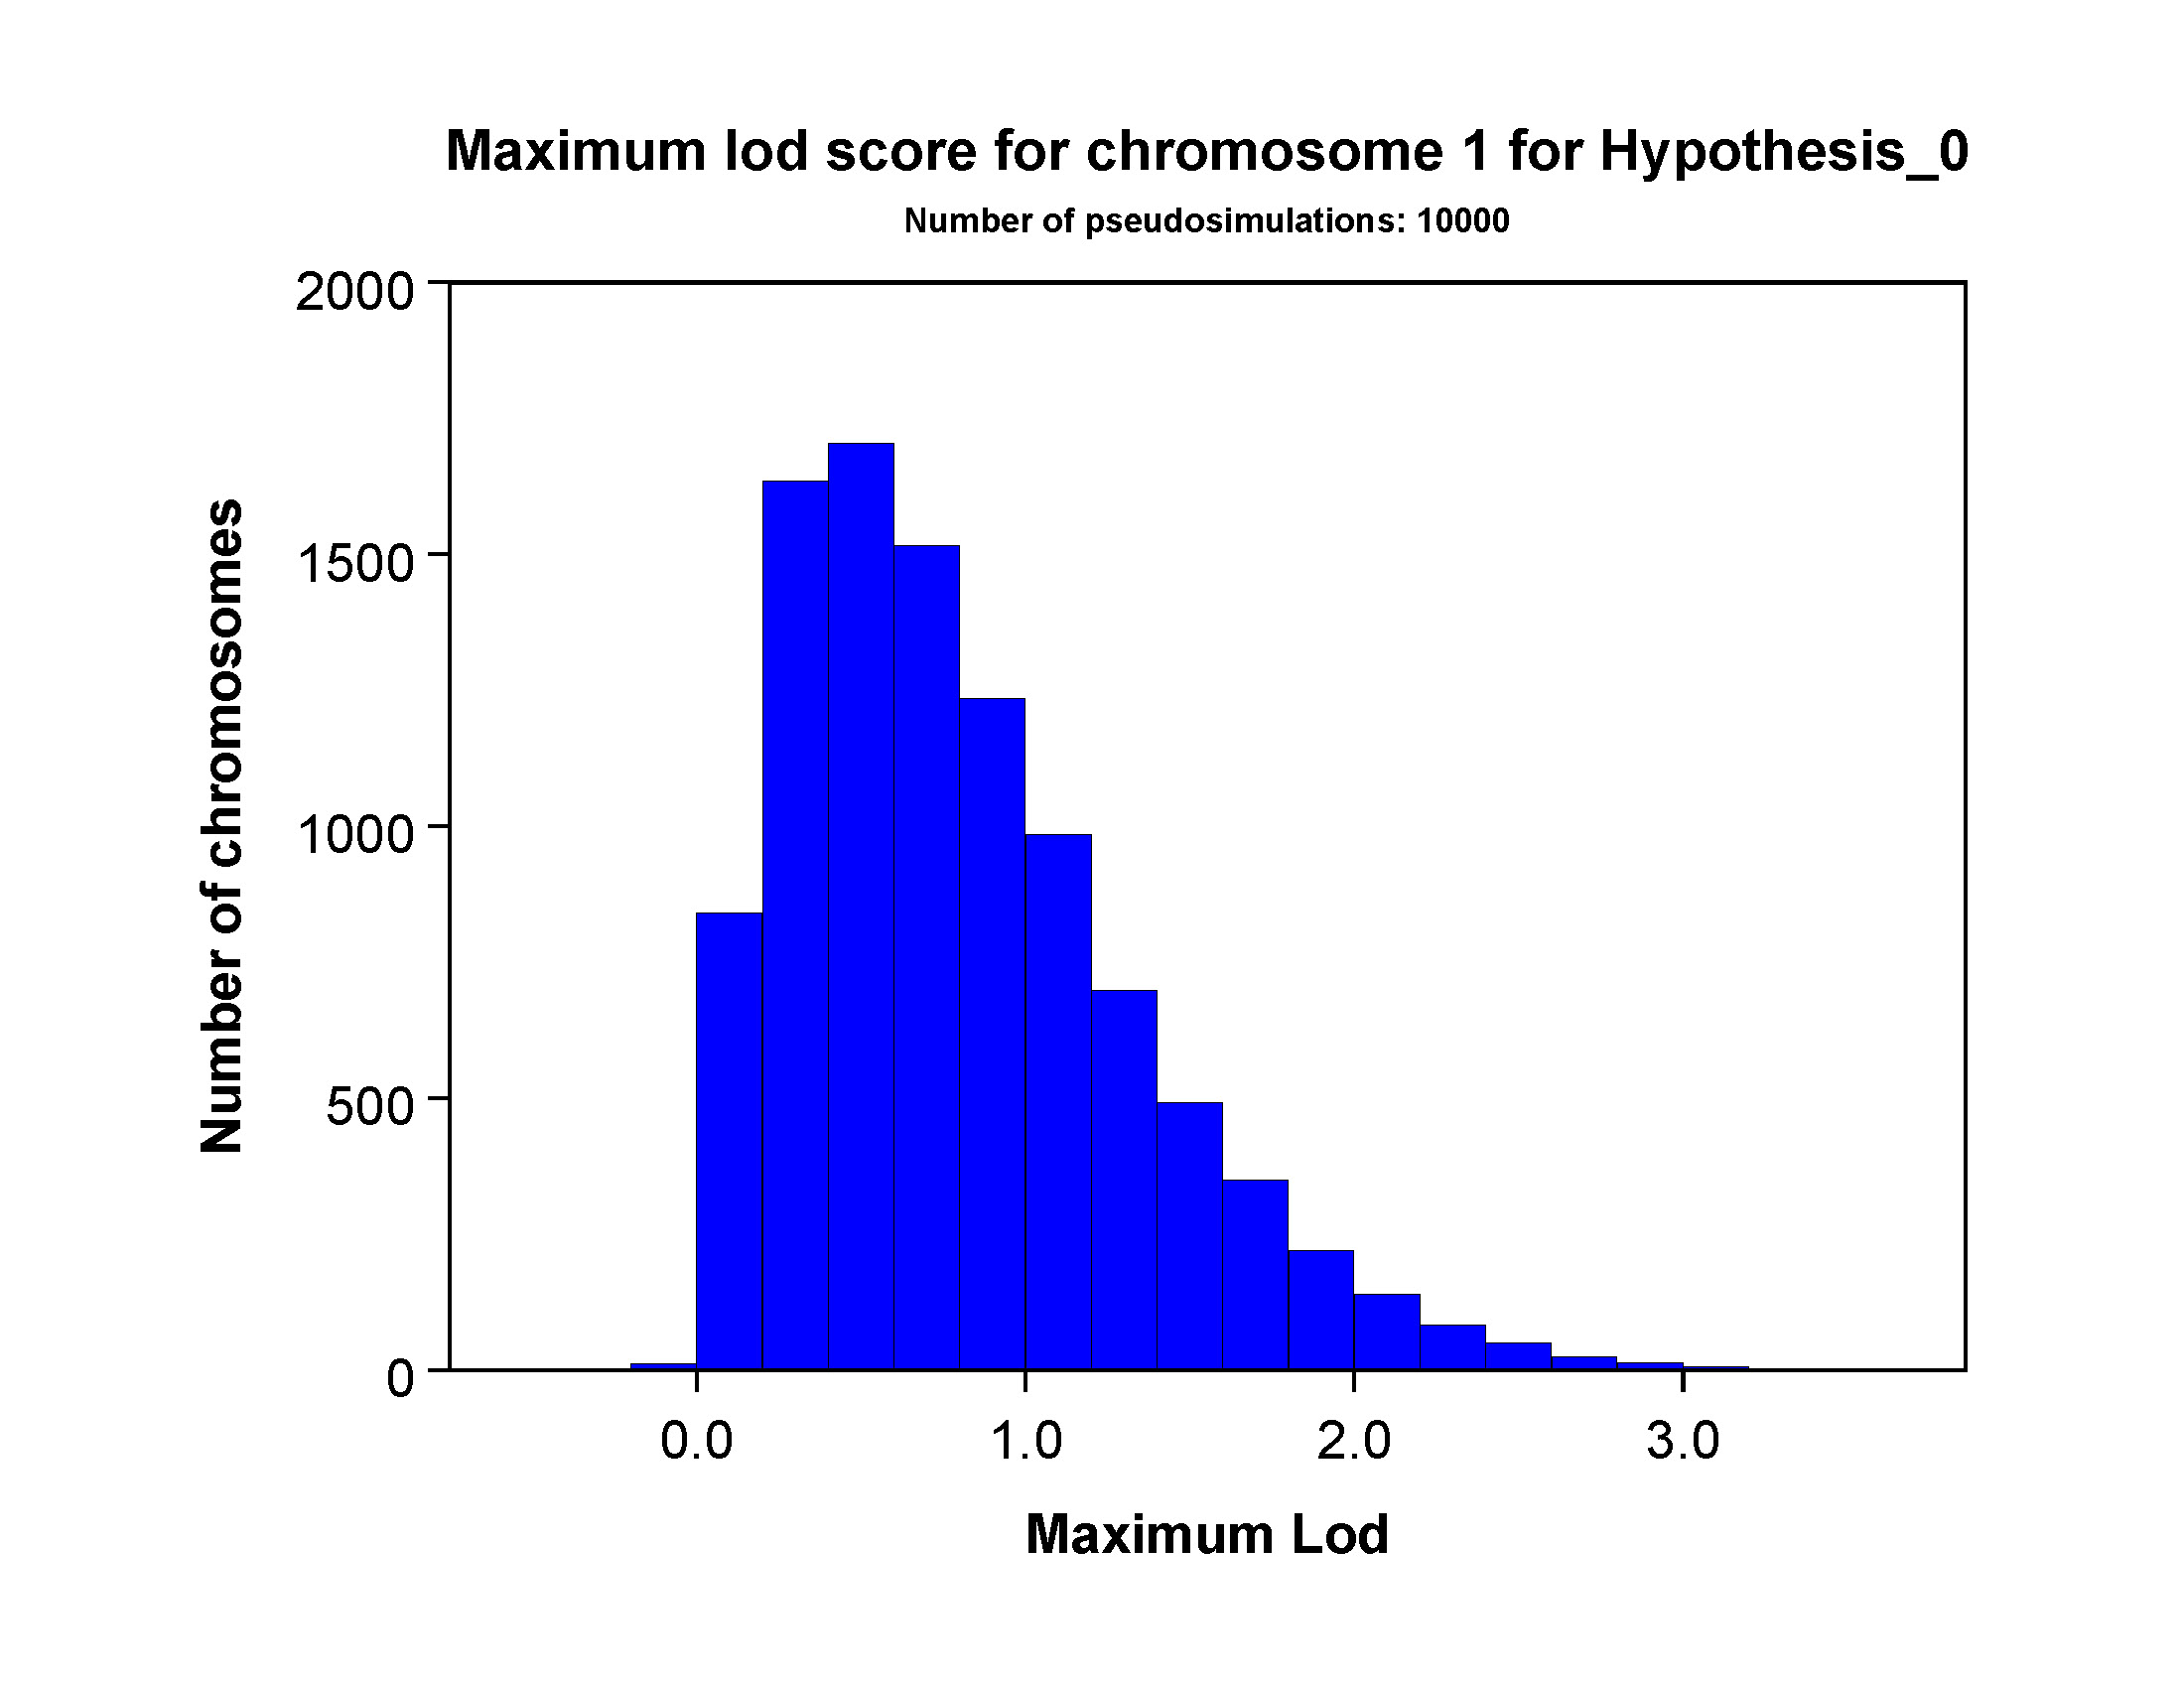
This section will also include one page showing the maximum simulated lod score for
each chromosome. If you look at Figure 3, you'll see typical Chromosome 1 results for
Hypothesis_0 for our example data set. Here, chromosome 1
is one of the longer chromosomes and the maximum lod score distribution for this chromosome will be slightly right-shifted
relative to shorter chromosomes.
Log hits per genome by lod score
| 